post

Fibres, Fabrics & Clothing – stats & info

Fibres are short fine hairs.
Fibres can be can be natural, synthetic or chemically produced hybrid called regenerated fibres.
Fibres can be twisted or spun into longer thread or yarn.
Threads can be woven or knitted into fabric.
The fabric often takes the name of the fibre such as cotton or wool.
It can also go under a trade name such as nylon.

Know Your Fibres

Fibres (and then yarns and ultimately fabrics) can be can be natural, synthetic or chemically produced hybrid called regenerated fibres.
Natural fibres
Are derived from plants like cotton or animals like wool and silk
Synthetic fibres
are man-made from chemicals many of which are petroleum derived.
Regenerated Fibres
The base material is cellulose that can be obtained from a range of sources including wood, paper, cotton fiber, or  bamboo. It is then converted through a chemical process into fibres.

Fabrics

Threads can be woven or knitted into fabric.
Blended Fabrics
Mixing synthetic and natural fibres such as poly cotton a mix of natural cotton and synthetic polyester.

Clothing

Clothes are then made out of woven/knitted fabrics or knitted yarn.

MORE

Read more about fibres and fabrics HERE.

fibre pie chart

Statistics

Fibre Production

2013 figures

Global 2013 fibre production estimated at 85.5 million tons

• Global 2013 synthetic fibre production estimated at 55.8 million tons (i.e. excluding cotton, cellulosics and wool)

Natural Fibres
Cotton 25 million tons
wool production is around 2.1 million tonnes.
Silk 150 000 tonnes in 2006
Linen 147 000 tonnes of flax fibre 2007,
Alpaca 6 500 tonnes
Cashmere” after scouring and dehairing 6 500 tonnes
Mohair is estimated at around 5 000 tonnes a year, down from a high of 25 000 tonnes in the 1990s,
Angora is estimated at 2 500 to 3 000 tonnes
2009 figures  only – google let me down!

Clothing Production

Clothes consumption has gone crazy. The introduction of cheap, synthetic fibres has meant that the price of new duds is dropping. This has had all kinds of consequences. here are some reports on the subject….

Cambridge University report issued 2006 titled Well Dressed? The Present and Future Sustainability of Clothing and Textiles in the United Kingdom
The followed statistics have been culled from the above report and have been lightly edited.
In 2000 the world’s consumers spent around US$1 trillion worldwide buying clothes. Around one third of sales were in Western Europe, one third in North America and one quarter in Asia.
Output from the sector is growing in volume, but prices are dropping, as is employment, as new technology and vertically integrated structures support improved productivity.
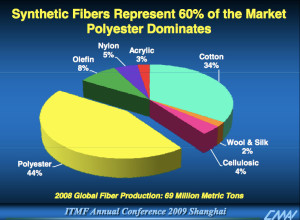
Growth in volumes is almost entirely associated with polyester – volumes of natural fibre production and use having remained approximately constant for several years.
3.25 million tonnes of clothing and textiles flow through the UK each year – approximately 55kg per person.
Approximately two thirds of the imports of fibres, yarns and fabrics to the UK are man-made.
Consumers in the UK spend about £780 per head per year, purchasing around 2.15 million tonnes (35kg per person) of which one eighth is sent for re-use through charities and the rest is discarded.
UK consumption of clothing and textile products Total consumption: 2,156 thousand tonnes About 50% clothing and 50% textiles
The major products consumed were: 420 thousand tonnes of trousers, T-shirts and pullovers 530 thousand tonnes of carpets
From 2001 to 2005 spending on women’s clothing grew by 21% and that on men’s by 14%. During the same time – as the end of the quota arrangement approached in 2005 – prices actually dropped by 14%
Consumers in the UK spend about £780 per head per year, purchasing around 2.15 million tonnes (35kg per person) of which one eighth is sent for re-use through charities and the rest is discarded.

You can download a copy for free here

WRAP have also been researching.
WRAP’s ground breaking report provides the first big picture look at the financial and environmental impacts of clothing.
Key findings include:
the average UK household owns around £4,000 worth of clothes – and around 30% of clothing in wardrobes has not been worn for at least a year;
the cost of this unused clothing is around £30 billion;
extending the average life of clothes by just three months of active use would lead to a 5-10% reduction in each of the carbon, water and waste footprints; and
an estimated £140 million worth (around 350,000 tonnes) of used clothing goes to landfill in the UK every year.

You can download valuing clothes report here

The Telegraph has something to say on the subject…
While every other waste streams going to landfill is reducing, the amount of textiles being buried in the ground has shot up by a third in recent years as people buy more cheap clothing than ever before as a result of the so-callled ‘Primark effect’.
Around 60 per cent of clothing sent for recycling is sold to other countries for re-use, mostly Africa and Eastern Europe, another 35 per cent is re-used as mattress stuffing or insulation and under five per cent is such low quality it is sent to landfill. Telegraph

Carbon footprint

O Ecotextiles

The estimated energy and water needed to produce that amount of fabric boggles the mind:

  • 1,074 billion kWh of electricity  or 132 million metric tons of coal and
  • between 6 – 9 trillion liters of water[3]

A study done by the Stockholm Environment Institute on behalf of the BioRegional Development Group  concludes that the energy used (and therefore the CO2 emitted) to create 1 ton of spun fiber is much higher for synthetics than for hemp or cotton:

KG of CO2 emissions per ton of spun fiber:
crop cultivation fiber production TOTAL
polyester USA 0.00 9.52 9.52
cotton, conventional, USA 4.20 1.70 5.90
hemp, conventional 1.90 2.15 4.05
cotton, organic, India 2.00 1.80 3.80
cotton, organic, USA 0.90 1.45 2.35

The table above only gives results for polyester; other synthetics have more of an impact:  acrylic is 30% more energy intensive in its production than polyester [7] and nylon is even higher than that.

Estimating the Carbon Footprint of Fabrics

today’s textile industry is one of the biggest sources of greenhouse gasses on Earth, due to the huge size and scope of the industry as well as the many processes and products that go into the making of textiles and finished textile products. (See Vivek Dev, “Carbon Footprint of Textiles”, April 3, 2009, http://www.domain-b.com/environment/20090403_carbon_footprint.html)

Ethical Fashion Forum

The largest climate change impact from clothing is the energy wasted in washing, tumble-drying and ironing. In the lifespan of an average T-shirt 50% of the global climate change impact comes from the washing process after it has ben purchased. This impact can be reduced simply by lowering the washing temperature and eliminating tumble drying and ironing. (Allwood et al. 2006)

Click to access Jungmichel._Systain.pdf

According to Procter & Gamble Co., the average American family does about 300 loads of laundry per year, or about six loads per week. That suggests a per-family carbon footprint from doing laundry of about 480 pounds per year, or about 10 pounds per week. And that doesn’t include running the dryer.

Key findings include:

  • the average UK household owns around £4,000 worth of clothes – and around 30% of clothing in wardrobes has not been worn for at least a year;
  • the cost of this unused clothing is around £30 billion;
  • extending the average life of clothes by just three months of active use would lead to a 5-10% reduction in each of the carbon, water and waste footprints; and
  • an estimated £100 million worth (based on 2015 prices) or around 350,000 tonnes of used clothing goes to landfill in the UK every year.

Micro Fibres

Traditional plastics degrade rather than biodegrade, which means they simply break up and fall apart into smaller pieces. The plastic has not changed its structure as such – merely fragmented. And it seems the process can continue indefinitely. Particles of plastic of 20 microns in diameter (a width thinner than a human hair) have been identified.

Sources of micro plastics are
Synthetic clothing that release thousands of plastic fibres every wash.
Read more here

Pollution

In November 2012, Greenpeace International investigated the use of hazardous chemicals used in dyes and they discovered that 63 percent of the clothing items they tested showed high traces of nonylphenol ethoxylates (NPEs), and others had highly toxic phthalates and carcinogenic amines.

report found that water pollution in China over the past few years has grown, with the textile industry responsible for pumping out 2.5 billion tons of wastewater per year.

Read the rest for yourself … it’s just as bad.

By Fibre

Cotton

Cotton represents nearly half the fibre used to make clothes and other textiles worldwide.

About 20 million tones of cotton are produced each year in around 90 countries.

China, United States, India, Pakistan, Uzbekistan and West Africa account for over 75% of global production.

Cotton represents nearly half the fibre used to make clothes and other textiles worldwide ( the rest is synthetic fibres)It can take more than 20,000 litres of water to produce 1kg of cotton; equivalent to a single T-shirt and pair of jeans. (Surely there is more cotton in jeans than in a tee shirt?)

Here are some more facts about cotton taken from this article in GOOD

textile mills consume 4.5 million bales of cotton yearly

a quarter of the total worldwide pesticide use occurs in cotton farming.

Each year, the World Health Organization estimates that three million people are poisoned by pesticide use

More

Read all our fabrics, clothes and related posts, HERE.

post

Nappies, tampons and wet wipes – dirty!

Nappies

The liner or topsheet – made of the plastic polymer polypropylene – sits next to the baby’s skin and protects against wetness. From this layer, fluids flow down through the pulp-based tissue layer and into the core.

The core contains fluff pulp and SAP, an absorbent polymer to draw in and contain the baby’s urine and faeces.

Leakage from the nappy is minimised by a plastic bottom layer and the elastic barriers that hold the nappy around the child’s waist. The nappy is thrown away after it is soiled.

The average baby will go through 5,000 nappies. As 85 per cent of people are using disposables, they now form 4 per cent of all household waste, costing the taxpayer £40m each year to dispose of them.

Of the approximately eight million disposable nappies used in the UK every day, around 7.5 million end up in landfill sites.

Disposable nappies use three and a half times more energy than real nappies to produce, eight times more non-renewable materials and 90 times more renewable resources.The ecologist

7 million trees are cut down every year just to make disposable nappies Green Box Day

Menstrual Products

Along with cotton buds, tampons, applicators and panty liners make up 7.3 % of items flushed down the toilet in the UK.3

For every kilometre of beach included in the Beachwatch survey weekend in 2010, 22.5 towels/panty liners/backing strips, and 8.9 tampon applicators, were found.
According to the Sewer Network Action Programme, even products that are described as flushable or biodegradable can contribute to more than half (55%) of sewer flooding due to blockages in sewers.

In the UK alone, we buy more than 3 billion items of menstrual lingerie every year, spending £349 million in 2010 on sanitary and ‘feminine hygiene’ products.

About 90% of the materials used to make sanitary pads and liners are plastic and include polyethylene, polypropylene and polyacrylate super absorbents.

Every year, over 45 billion feminine hygiene products are disposed of somewhere.

Commercial production of superabsorbent polymers began in Japan in 1978 for use in sanitary pads. In the 80’s, using crude oil derived raw materials, European manufacturers enhanced the polymer so that it now absorbed 30 times it’s own weight under pressure. By the mid 90’s, production of SAP jumped to a massive 700 million tons. 75% used in diaper production, 10% in incontinence products, 10% in sanitary pads, and the rest in meat trays, etc.

Sources

natracare and womens environmental network

Items such as nappy liners, ‘flushable’ wipes and toilet seat liners cause many problems. But the main pest are women’s sanitary items.

The council says every single one has to be removed and sorted by hand by workers at waste stations.

Oh Yuck! Jesse Peach went to check out the undesirables in Wellington that haunt drains beneath our feet. Read more: 

Find out How to Menstruate Plastic Free here

plastic plankton
As we already know from this blog,tiny sea creatures, the bedrock of the food chain, ingest these micro plastics. You can see plankton hoovering up plastic here.  There is increasing evidence that this is not a healthy diet.

Best to cut back on synthetics especially  those items that may get get washed into the sea.


You can find out about natural fibres here


post

Disposing Of Plastic

In this post you can read about the many ways we dispose of plastic.
Most plastics are made from oil and most plastics do not biodegrade. See how and why here…
which  makes it difficult to dispose of.

There are no natural processes in place that can absorb non biodegradable  plastic back into the biological cycle. It cannot be composted or left to rot where it is dropped or dumped like organic rubbish. Read more about the plastic lifespan here.

Most plastic lasts  for decades, maybe centuries, possibly for ever.

WHICH MEANS that every bit of plastic created has to be collected up and specially treated. All of these processes are time-consuming and so expensive.

Main methods are
Landfill
Recycling and Reusing
Incineration & Waste to Energy –
Gasification
Pyrolysis
Thermal depolymerization

Landfill

Just A big hole that we fill with rubbish. The theory was that waste would slowly biodegrade. Plastics do not biodegrade so once in a landfill it will sit there forever. That said turns out that a lot of rubbish in landfill sites do not biodegrade. William Rathje, of the University of Arizona, excavates landfill sites and  has found  newspapers printed in the 1950s that could still be read. Consequently the landfill is rapidly filling up.

Recycling and Reusing 

Let’s be clear about this recycling is just a more responsible form of waste management. That stuff in your recycle bin is still rubbish and has to be dealt with the attendant environmental and financial costs. While recycling may offset these costs it is still expensive. Moreover recycling does not address the main issue of misusing plastic and stupidly using it to make one use throwaway items.

With that in mind lets look at plastic recycling.

Incineration & Waste to Energy –

Incinerating plastic which means burning it.  At best this adds to global warming and at worst releases dioxins on of the most carcinogens known.  Sometimes using the heat created is used to generate electricity which offsets the cost of waste disposal.
N.B. only offsets!

Other Plastic To Energy Processes

Technofix – updates on the latest ways to sort it out


Plastic Waste & The Poor

As noted all the above are expensive. They require special treatment facilities, a decent infrastructure of roads and a reliable rubbish collection service. Theses facilities are often not available to poorer communities, certainly not those based in the more remote parts of the world.  They have two methods of plastic waste disposal

Burning plastic – On open fires could be safe or it could kill you – depends on the plastic  Find out more here

Dumping  –  on the outskirts of town, a major cause of plastic pollution and potential death for  animals who forage there.
Read about plastic and animals here

And more about the other problems with plastic here….

post

Reports & Statistics Index

Post Index

Wasting Away – how much rubbish do we create globally
Definitions You can find definitions, clarifications and explanations here

Number CrunchingFor nasty stats go to  Statistics
Reports

Find all reports here  or by look by category below.

Post

For the latest news, reports on and about plastic plus statistics to shame any one who still thinks disposable carrier bags are a good idea!

Check out these scary stats: Wasting Away – how much rubbish do we create globally

Definitions

Don’t know your P.E.Ts from your pets? You can find definitions, clarifications and explanations here

Number Crunching

“Our previous work had suggested that bottled water production was an energy-intensive process, but we were surprised to see that the energy equivalent of nearly 17 million barrels of oil are required to produce the PET bottles alone,” Cooley told PhysOrg.com.

For more nasty stats go to  Statistics

Reports

Check out the latest scientific reports on plastic and the effects it is having on everything from plankton to elephants

Find all reports here  or by look by category below.

And the latest new reports as rounded up by Fabiano of www.globalgarbage.org are here. Thank you for all his hard work.

By Category

How much does plastic cost us

Everlasting Litter & Plastic Pollution

Seas Of Rubbish

Micro plastic trash 

Plastic and Animals

Chemicals in plastics 

People Who Know

Expert Opinions from people who have studied the subject and kindly submitted guest posts in People Who Know.

All Reports

post

Food Waste

Almost 50% of the total amount of food thrown away in the UK comes from our homes. We throw away 7 million tonnes of food and drink from our homes every year in the UK, and more than half of this is food and drink we could have eaten. Love Food Hate Waste

Every tonne of biodegradable waste produces 300-500 cubic metres of landfill gas From Green Box Day

Global methane emissions from landfill are estimated to be between 30 and 70 million tonnes each year. Most of this landfill methane currently comes from developed countries, where the levels of waste tend to be highest.

Over a 20 year period, one ton of methane causes 72 times more warming than one ton of carbon dioxide (CO2).Read more about methane

We throw away 7.2 million tonnes of food and drink from our homes every year, the majority of which could have been eaten. This costs us £12 billion a year, harms the environment and wastes resources. In the UK food industry, waste is estimated to cost £5 billion per year. HMGov

Every year we (Americans) generate around 14 million tons of food waste which is 106 pounds of food waste per person 570,000 tons of this is composted for a 4.1% recovery rate. The rest, or 13.4 million tons is incinerated or landfilled and occupies 6.3 million cubic yards of landfilled MSW. EPA Gov Paper

The single largest producer of food waste in the United Kingdom is the domestic household. In 2007, households created 6,700,000 tonnes of food waste – accounting for 19 per cent of all municipal solid waste.[33] Potatoes account for the largest quantity of avoidable[d] food disposed of; 359,000 tonnes per year are thrown away, 49 per cent (177,400 tonnes) of which are untouched.[34] Bread slices account for the second food type most disposed of (328,000 tonnes per year), and apples the third (190,000 tonnes per year).[34] Salad is disposed of in the greatest proportion – 45 per cent of all salad purchased by weight will be thrown away uneaten.[35] (Wikipedia)

In 2012, the European Com- mission set a target of reducing by 50 percent the rate
of food loss and waste in Europe by 2020.28 If this target were extended globally to 2050, our analysis suggests that achieving it would reduce the need to produce 1,314 tril- lion kcal of food per year in 2050 relative to the business- as-usual scenario described in “The Great Balancing Act,” the rst installment of this World Resources Report work- ing paper series.29 In other words, cutting the global rate of food loss and waste from 24 percent of calories down

to 12 percent would close roughly 22 percent of the 6,000 trillion kcal per year gap between food available today and that needed in 2050.30 Thus our analysis suggests that reducing food loss and waste could be one of the leading global strategies or “menu items” for achieving a sustain- able food future.

Global Food Losses & Waste report


post

Plastic Trash By Country

Statistics can be wobbly and there will be discrepancies between reports but even bearing that in mind it is obvious we are making a great deal of plastic rubbish most of which we are not recycling. And our use of plastic is increasing every year.

Since the 1950s, one billion tons of plastic have been discarded.

During the first year, sales of Coca-Cola averaged nine drinks a day, adding up to total sales for that year of $50. Today, products of The Coca-Cola Company are consumed at the rate of more than 1.8 billion drinks per day.FAQs: The Coca-Cola Company

U.K.

Each UK household produces over 1 tonne of rubbish annually, amounting to about 31 million tonnes for the UK each year.

How much of the is plastic? And how much is recycled?

In October 2006 when I started my plastic boycott I saved all my plastic for a week. The amounts of waste we, a fairly green couple, produced was worrying.

British consumers got through nine billion pints of milk last year. 90% of that milk was bought in a plastic container.

2015 and Recycle now states the average UK household uses 480 plastic bottles a year but only recycles 270 of them – meaning nearly half (44%) are NOT put in the recycling.

Wrap state

Around 40% of plastic is used in packaging and the UK generates around 2.4 million tonnes per year of packaging waste. Of this, around 1.7 million tonnes is from households.

In the UK we currently recycle around 50% of plastic bottles and just 12-15% of mixed plastics, so there is still progress to be made.
The Guardian writes Of the 1.5m tonnes of recyclable plastic waste used by consumers in Britain in 2015 only 500,000 tonnes was recycled, according to the figures compiled by Co-op from the Recoup UK Household Plastics Collection survey. 

Recycle More  estimate that nearly 1.2 million tonnes of plastics packaging are consumed by households in the UK (source:recoup)
From this 1.2 million tonnes, it is reported that 440,401 tonnes is collected for recycling – an overall 37% recycling rate (source:recoup)

The Recycling Guide states that most families throw away about 40kg of plastic per year, which could otherwise be recycled.

  • They also claim that
  • The use of plastic in Western Europe is growing about 4% each year.
  • Plastic can take up to 500 years to decompose.

2011 Government Statistics for the UK – rather different story – but still not good.

Plastic 2,515,809 Total packaging waste arising (tonnes) 609,910 Total recovered/recyled (tonnes) 22.5 EU Target (%) 24.2 Recovery/recycling rate (%)

Recoup

RECycling Of Used Plastics Limited (RECOUP) is a registered charity and not-for-profit member based organisation. RECOUP works in collaboration with all stakeholders to promote, develop, stimulate and increase the levels of plastics recycling within the UK.

Their latest survey can be downloaded here http://www.recoup.org/p/229/uk-household-plastics-collection-survey-2016

Some Solutions

Find plastic free products here

World

See what everyone else is throwing away. This is only the briefest of outlines to illustrate the scale of the problem. It doesn’t matter who throws more but that we all get on cleaning our own back yards.


Planet Trash – A page of images showing  plastic pollution the world over plus one of the biggest list of anti plastic groups on Facebook.
You can find a full list of places featured here.

Europe

Plastics consumption is growing about 4% every year in western Europe.

We produce and use 20 times more plastic today than we did 50 years ago!

America

In 2010, Americans created  31 million tons of plastic waste. It consisted of

  • 14 million tons of containers and packaging,
  • 11 million tons as durable goods, such as appliances,
  • 7 million tons as non-durable goods, for example plates and cups.

(ermmm that makes 32million tons?…)

Only 8 percent of the total plastic waste generated in 2010 was recovered for recycling.

  • Only 12% of bags, sacks, and wraps were recycled

These figures are from the U.S Environmental Protection Agency who go on to note

“The recycling rate for different types of plastic varies greatly, resulting in an overall plastics recycling rate of only 8 percent, or 2.4 million tons in 2010. However, the recycling rate for some plastics is much higher, for example in 2010, 28 percent of HDPE bottles and 29 percent of PET bottles and jars were recycled”.

According to the Beverage Marketing Corporation, Americans bought a total of 31.2 billion liters of water in 2006, Most of this water was sold in polyethylene terephthalate (PET) bottles, requiring nearly 900,000 tons of the plastic and more than 106 billion megajoules of energy.

California

Californias governing body have this to say “In the United States, consumers use 100 billion plastic bags annually, but fewer than 5 percent of plastic bags are recycled, which means they eventually end up in landfills, open spaces, or waterways.

  • Californians use an estimated 12 billion plastic bags annually. That’s almost 400 bags per second.
  • In California, approximately 247 million pounds—that’s 24 billion bags!—end up in landfills every year.
  • California spends approximately $25 million annually to landfill discarded plastic bags. Public agencies in California spend more than $300 million annually for litter abatement.”

25 MILLION???? ON BAGS???

 13 billion plastic carrier bags are used in the UK each year. Shoppers worldwide are using approximately 500 billion single-use plastic bags per year.

People

This fantastic collection of photos shows what people eat in a week the world over. Humbling? yes…but also check out the packaging! Way to go Japan!

Problems

The problem with plastic waste,  is that plastic doesn’t  biodegrade. There are no natural processes in place that can absorb plastic back into the biological cycle. Drop it and leave it, as  with an apple core say, and rather than rot away, it stays there…for decades, maybe centuries, possibly for ever.

So it has to be specially disposed of. It has to be collected up and specially treated. Either burnt or buried or, in very small amounts, recycled.

And we are using this product to make one use throwaway items.

The result? Everlasting litter! That’s just dumb.

Yet simply by saying no to unneccessary plastic, you can cut your pile of trash almost completely.

More

Find other rubbish statistics here

Cut Your Trash


Find plastic free products and lifestyle hacks here

Plastic Is Rubbish–  group, join, share, rant, post. A resource for plastic less living. As the interest in zero waste and plastic free living grows we need a space to pool resources  – especially in the U.K. where we don’t have bulk stores and finding unpackaged produce is so much harder. I hope that people will use it to share plastic free info and lifestyle hacks. Join us here.

post

Weee / Electronic Waste

 Between now and the end of 2020, WRAP estimates that electronic products purchased in the UK will total around 10 million tonnes. A quarter of this will comprise of IT equipment, consumer electronics and display screens. This 10 million tonnes will include precious metals, such as 20 tonnes of gold, 400 tonnes of silver and 7 tonnes of Platinum Group Metals. These have a total estimated market value of £1.5 billion [Dec 13].Waste on line

According to DEFRA figures, white goods make up 5% of household waste. 7 WEEE analysis shows that the average person will consume 3.3 tonnes of electronic waste in their lifetime, or on average around 0.016 tonnes (16 kg) per year. http://www.weeeman.org/html/impact/couple.html

Most of the components of electronic waste are recyclable, a fridge may contain as much as 95% recoverable material, whereas 96% of an old television could be made into new televisions.  do the green thing.

Wee waste has to be specially disposed of….

The directors of Warrington-based Daniels Recycling, who pleaded guilty last week to illegally exporting electrical waste to West Africa, have criticised the Environment Agency for its handling of the case.

Daniels Recycling Ltd is run by married couple Mark Daniels, 51, and Lynn Gallop, 52. At Warrington Crown Court last week, the pair pleaded guilty to illegally exporting 187 tonnes of waste electrical and electronic equipment (WEEE) to Nigeria, Ghana, the Ivory Coast, Tanzania, Gambia and Togo between 2011 and 2015. They were ordered by the court to pay fines and costs totalling £130,000.